Power BI → Operational Intelligence
Transforming operational data into meaningful insights for claims monitoring, workload management and performance tracking.
Dashboard Development Journey
From backend operational data to actionable insight.
From Raw Data to Dashboard
- Worked with structured backend operational data and arranged the available data into a usable structure for reporting and analysis.
- Performed data cleaning and transformation using Power Query to prepare operational fields for consistent reporting.
- Applied DAX to create calculated measures, derived metrics and business logic required for operational monitoring and KPI analysis.
- Structured and arranged JSON-based data where required to extract and organise relevant information for dashboard development.
- Developed data relationships and modelling logic within Power BI to support consistent analysis across claims status, workload and performance measures.
- Collaborated with IT and analytics teams on backend data integration and data availability to support dashboard development and refresh capability.
The dashboard development involved data preparation, transformation and analytical modelling in addition to visualisation.
Power BI Analytics
Selected dashboard views demonstrating how operational data was translated into monitoring and performance insights.
01 | Programme Achievement
Monitoring claims movement across key processing stages.
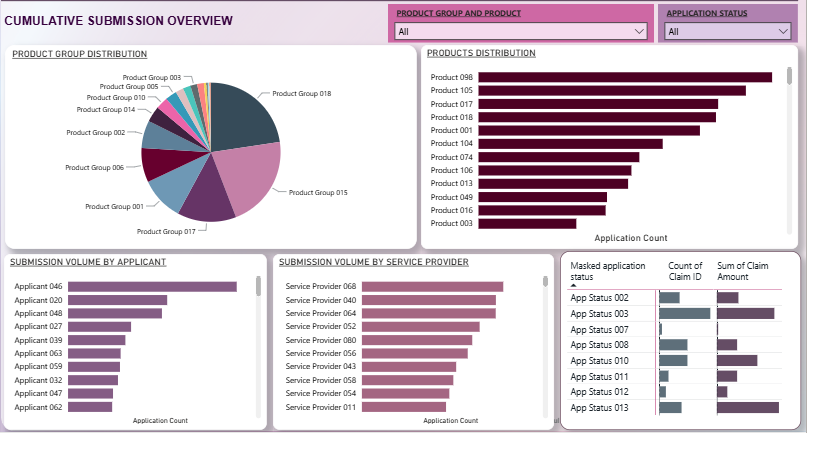
- Cumulative Submission Overview: Provides a consolidated view of stakeholder submission volume, service categories, and products applied for, enabling management to understand overall demand at a glance.
- Demand & Product Monitoring: Highlights the top 5 products by submission volume and helps identify whether newly introduced procedures or products are being utilised by stakeholders.
- Processing Complexity: Provides visibility into service and product mix, supporting workload assessment and appropriate verifier assignment based on submission complexity.
- Claim Value Prioritisation: Compares submission volume and claim amounts across services, enabling management to prioritise escalation based on workload volume or higher-value claims.
- Stakeholder & Status Monitoring: Allows users to analyse submission volume by stakeholder and drill down by application status, helping identify high-volume stakeholders and areas requiring timely follow-up.
- Management Decision Support: Combines submission volume, product demand, service mix, claim value, stakeholder activity, and application status to support data-driven workload prioritisation and operational decision-making.
02 | Claims with Issues
Monitoring Pending/Rejected claims
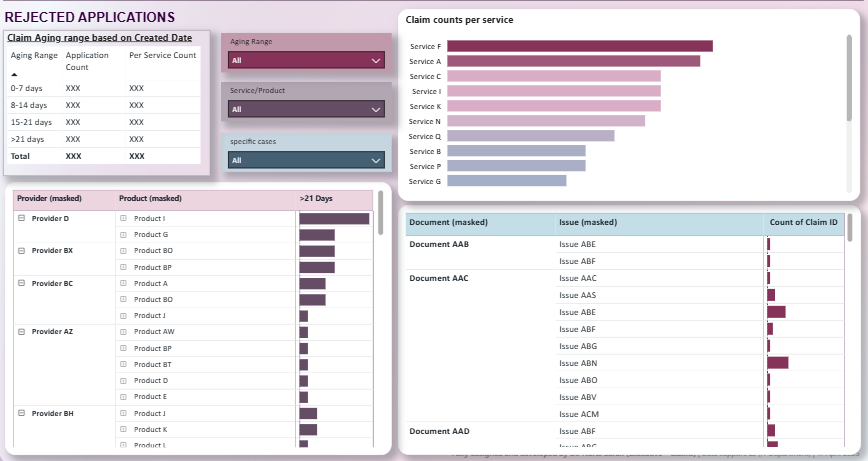
Rejected Cases Overview
Provides an overview of rejected claims, highlighting rejection patterns, issue categories, and case trends to support monitoring and follow-up.
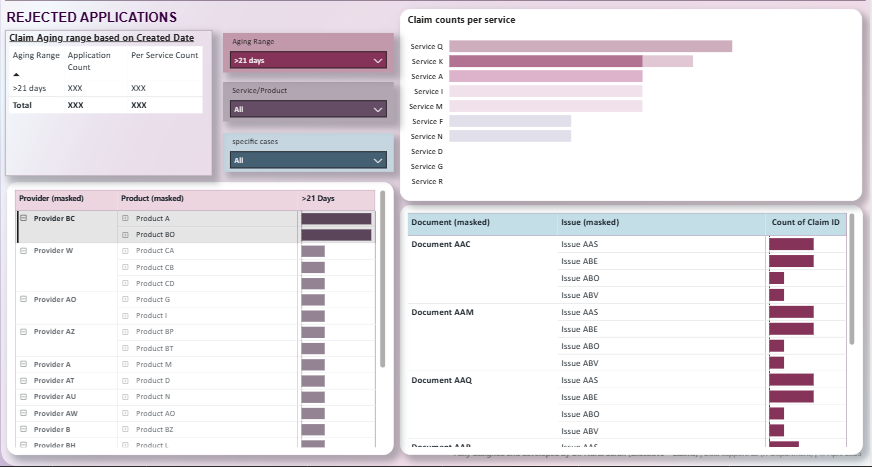
Rejected Claims Analysis
- Highlights the Top 5 Providers with the highest number of rejected claims.
- Interactive provider selection filters the related issues and documents for faster investigation.
- Aging Overview helps the Monitoring PIC identify claims requiring close monitoring versus routine reminders.
03 | Staff Daily Progress
Monitoring individual daily workload and progress.
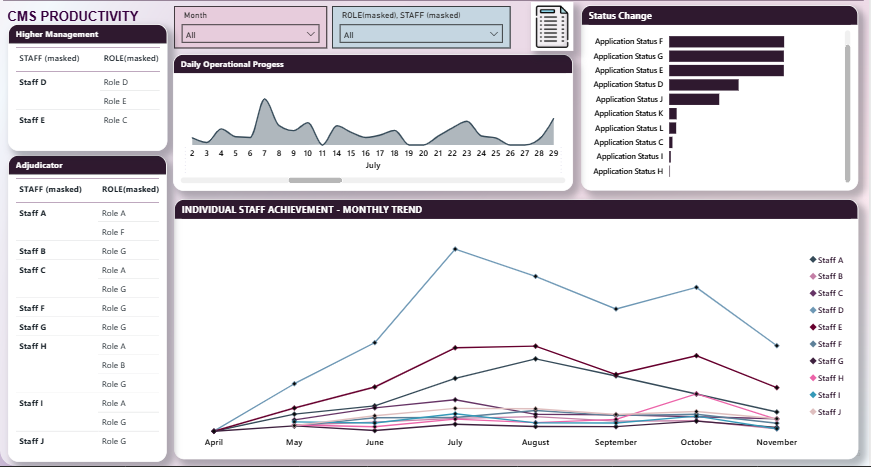
- Individual Performance Monitoring: Provides visibility into individual staff performance using the latest available operational data, typically reflecting activity up to the previous day.
- Automated Performance Visibility: With automated data refresh, management can review the previous day's staff performance directly without relying on separate reporting from the Monitoring PIC or Team Leader.
- Workload & Product Tracking: Shows the products and services handled by each staff member, together with the number of claims attended and their latest application status.
- Detailed Claim-Level Visibility: Enables users to drill down into individual workloads and identify the latest claims attended, providing greater visibility into actual operational activity.
- Daily KPI Monitoring: Compares individual daily performance against the defined KPI, allowing potential performance gaps to be identified promptly rather than only during periodic KPI discussions.
- Performance Context & Follow-Up: Provides management with operational context when a staff member falls below the daily KPI, supporting further review of workload, claim complexity, or other operational activities that may have affected performance.
04 | Programme Performance
Monitoring overall claims movement at team level.
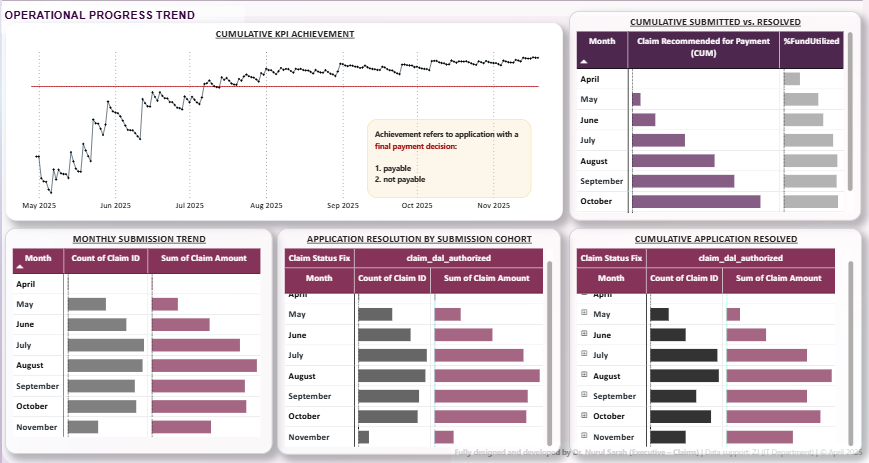
- Daily Team Performance Monitoring: Replaced periodic manual CSV extraction, cleaning, and KPI reporting with continuous visibility of team performance against the defined KPI.
- Automated Data Refresh: Reflects the latest available operational data, typically up to the previous day, allowing the team and management to monitor recent performance without waiting for manual reporting.
- KPI & Performance Tracking: Applies agreed operational definitions and DAX-based calculations to track cumulative performance and identify gaps against the KPI target.
- Performance Improvement: Historical trends highlighted an early performance gap that was not immediately visible through periodic reporting. Continuous monitoring subsequently supported the team in maintaining cumulative performance above the KPI target.
- Team Capacity & Resolution: Tracks monthly claims resolved against submission volume to assess processing capacity, resolution rates, and potential pending workload.
- Operational & Management Insights: Compares monthly submission volume with claim amount, providing visibility into workload and financial value to support performance monitoring and management prioritisation.
Analytical Approach
- Translated operational requirements into measurable Power BI indicators for daily monitoring and KPI tracking.
- Structured data according to the operational questions that needed to be answered, rather than visualising raw data directly.
- Used data transformation, calculated measures and data modelling to ensure consistent interpretation of operational metrics.
- Designed separate views for operational progress, individual workload and overall team performance.
- Used dashboard insights to improve operational visibility, support workload allocation and identify claims requiring further attention.
Technical Skills
Confidentiality & Data Disclaimer
Selected dashboard screenshots are presented using anonymised, modified or sample data for portfolio demonstration purposes.
Data values, labels and selected dashboard elements have been changed or masked to protect confidential operational information, system identifiers and personal data.
The dashboard structure and selected arrangements have been adapted to mimic the real operational workflow while preserving the analytical approach and visualisation concepts.
The examples shown are intended to demonstrate the approach to data preparation, transformation, modelling, KPI development and visualisation without disclosing confidential operational information.